Monitor
Live performance of your Mac, updated every second, with the running model beside it.
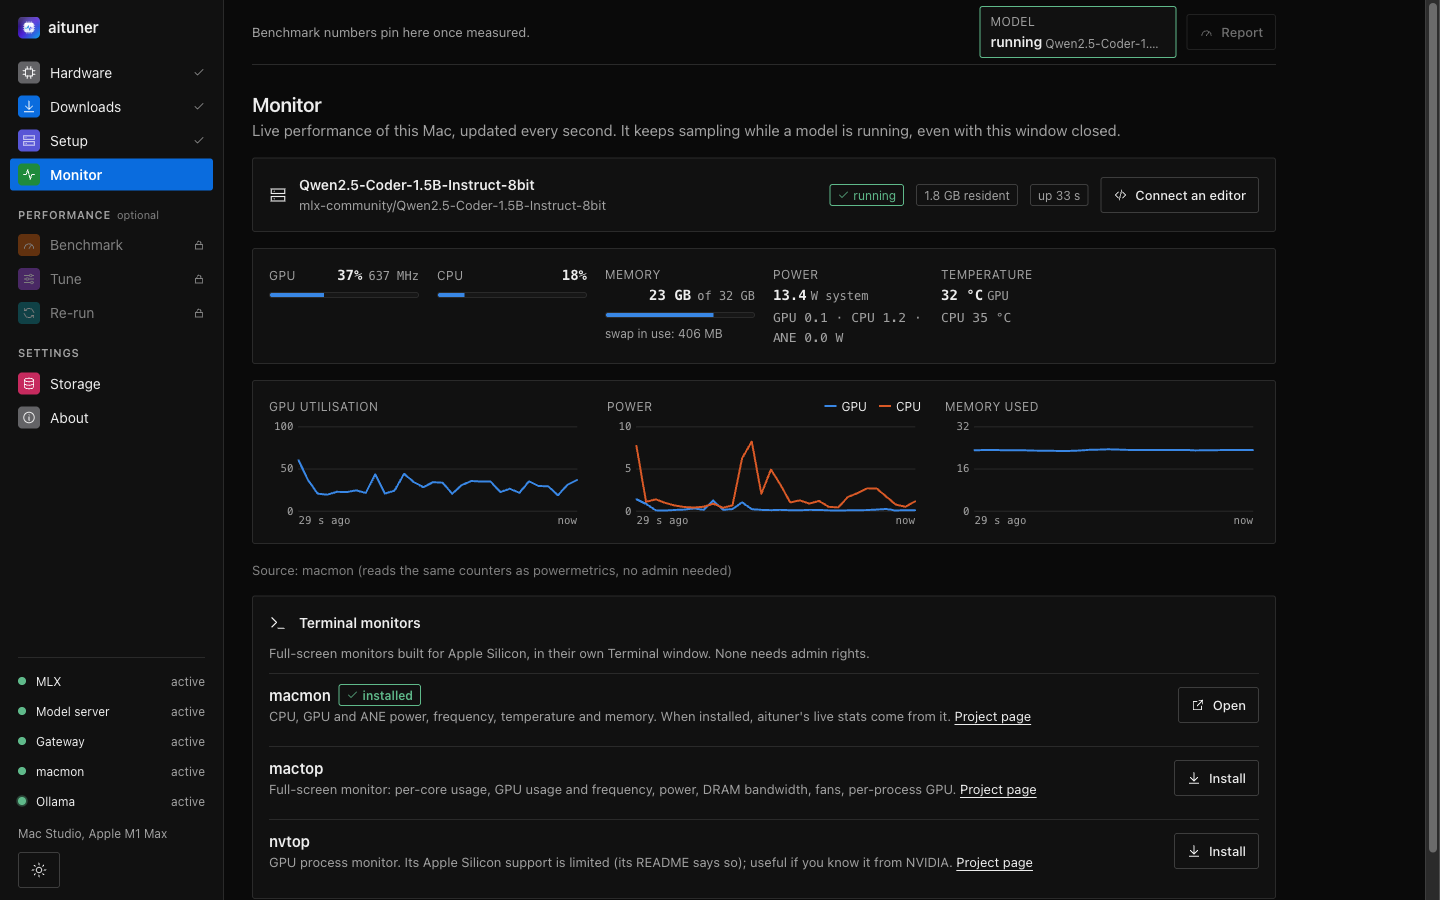
What it shows
- GPU use and frequency, CPU use, memory and swap.
- Power for the whole system and for the GPU, CPU and Neural Engine.
- GPU and CPU temperatures.
- The last five minutes as charts, and the running model with its memory and uptime.
These readings come from macmon, which reads the same counters as powermetrics without admin rights; Bootstrap installs it. Without macmon, aituner's own sampler shows GPU use and memory only, and marks the rest as unavailable rather than guessing.
Menu bar
Click the gauge icon in the menu bar for a panel with the live model, a GPU meter, the last minute of GPU use, memory, power and temperature. It also opens the main window or quits aituner.
In the background
Monitoring runs while you look at it, and whenever a model is being served, even with the window closed. It stops by itself when neither is true.
Terminal monitors
Monitor can install and open full-screen terminal monitors built for Apple Silicon: macmon, mactop, and nvtop (whose Apple support is limited, as its own documentation says). None needs admin rights.